> ## Documentation Index
> Fetch the complete documentation index at: https://docs.pnplayer.com/llms.txt
> Use this file to discover all available pages before exploring further.
# Analytics
> Use the Analytics dashboard to monitor video performance, track engagement, and generate reports.
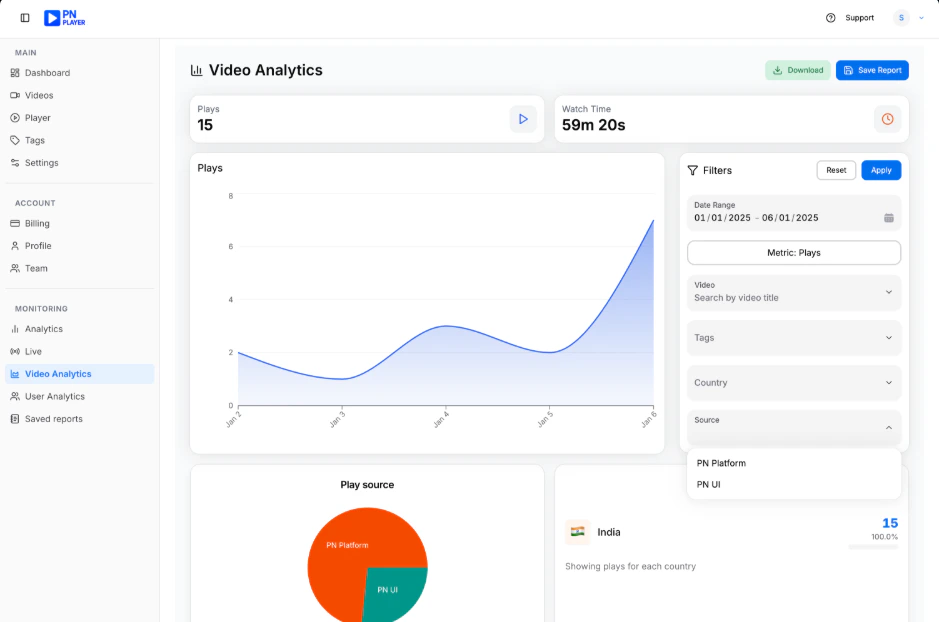 At the top of the dashboard, choose a start and end date to filter analytics data for a specific timeframe.
Example: Select 1 Jan 2026 as the start date and 7 Jan 2026 as the end date to analyze performance for the first week of January.
After selecting the date range, click Generate Report to refresh and load updated analytics data.
Example: After choosing 1 Jan 2026 – 7 Jan 2026, click Generate Report. The dashboard updates to show analytics only for those 7 days.
Check the Plays summary card to see the total number of video plays during the selected period.
Example: For 1 Jan – 7 Jan 2026, the Plays card shows 1,250 plays.\
This means your videos were played 1,250 times during that week.
Review the Watch Time card to see total accumulated viewing time (e.g., minutes and seconds).
Example: For 1 Jan – 7 Jan 2026, Watch Time shows 32 hours 15 minutes.\
This represents the total time users spent watching your videos in that period.
Examine the area chart under the summary cards to understand how plays change day by day within the selected period.
Example: Between 1 Jan – 7 Jan 2026:
* Jan 1 – 120 plays
* Jan 3 – 300 plays (peak)
* Jan 6 – 150 plays
This helps you identify high-performance days and engagement spikes.
Look at the Play Source pie chart to see how plays are distributed across sources such as:
* PN Platform
* Demo
* Localhost
Example (1 Jan – 7 Jan 2026):
* PN Platform – 70%
* Demo – 20%
* Localhost – 10%
This shows most plays came from the production platform.
View the Country Plays section to see which country generated plays and the percentage contribution.
Example (1 Jan – 7 Jan 2026):
* India – 80%
* United States – 15%
* United Kingdom – 5%
This helps identify your strongest geographic audience.
Scroll down to the Top Videos table to compare:
* Video name
* Total watch time
* Total plays
* Percentage contribution
Example (1 Jan – 7 Jan 2026):
* Product Demo.mp4 – 500 plays – 12 hrs watch time – 40%
* Tutorial Part 1.mp4 – 400 plays – 10 hrs watch time – 32%
* Intro Video.mp4 – 350 plays – 10 hrs 15 min watch time – 28%
Use the Top Videos table to identify which video has the highest engagement based on plays and watch time.
Example: During 1 Jan – 7 Jan 2026,\
Product Demo.mp4 has the highest plays and watch time, making it the best-performing video for that week.
## Saved Analytics reports
Saved Reports allows users to view and manage previously generated analytics reports.
When a user opens the Saved Reports page:
* A request is sent to the backend to fetch all saved reports
* The reports are displayed in a structured table
* Loading indicators are shown while data is being fetched
Each saved report includes:
* Report name
* Report URL
* Created by
* Created at
Users can:
* Open the report in a new tab
* Delete a report securely
* View creation details
Deletion process:
* User clicks delete
* A DELETE request is sent with authorization token
* On success, the report is removed from the list
* A success or error message is displayed
This feature ensures persistent report access, secure management, and easy report lifecycle control.
At the top of the dashboard, choose a start and end date to filter analytics data for a specific timeframe.
Example: Select 1 Jan 2026 as the start date and 7 Jan 2026 as the end date to analyze performance for the first week of January.
After selecting the date range, click Generate Report to refresh and load updated analytics data.
Example: After choosing 1 Jan 2026 – 7 Jan 2026, click Generate Report. The dashboard updates to show analytics only for those 7 days.
Check the Plays summary card to see the total number of video plays during the selected period.
Example: For 1 Jan – 7 Jan 2026, the Plays card shows 1,250 plays.\
This means your videos were played 1,250 times during that week.
Review the Watch Time card to see total accumulated viewing time (e.g., minutes and seconds).
Example: For 1 Jan – 7 Jan 2026, Watch Time shows 32 hours 15 minutes.\
This represents the total time users spent watching your videos in that period.
Examine the area chart under the summary cards to understand how plays change day by day within the selected period.
Example: Between 1 Jan – 7 Jan 2026:
* Jan 1 – 120 plays
* Jan 3 – 300 plays (peak)
* Jan 6 – 150 plays
This helps you identify high-performance days and engagement spikes.
Look at the Play Source pie chart to see how plays are distributed across sources such as:
* PN Platform
* Demo
* Localhost
Example (1 Jan – 7 Jan 2026):
* PN Platform – 70%
* Demo – 20%
* Localhost – 10%
This shows most plays came from the production platform.
View the Country Plays section to see which country generated plays and the percentage contribution.
Example (1 Jan – 7 Jan 2026):
* India – 80%
* United States – 15%
* United Kingdom – 5%
This helps identify your strongest geographic audience.
Scroll down to the Top Videos table to compare:
* Video name
* Total watch time
* Total plays
* Percentage contribution
Example (1 Jan – 7 Jan 2026):
* Product Demo.mp4 – 500 plays – 12 hrs watch time – 40%
* Tutorial Part 1.mp4 – 400 plays – 10 hrs watch time – 32%
* Intro Video.mp4 – 350 plays – 10 hrs 15 min watch time – 28%
Use the Top Videos table to identify which video has the highest engagement based on plays and watch time.
Example: During 1 Jan – 7 Jan 2026,\
Product Demo.mp4 has the highest plays and watch time, making it the best-performing video for that week.
## Saved Analytics reports
Saved Reports allows users to view and manage previously generated analytics reports.
When a user opens the Saved Reports page:
* A request is sent to the backend to fetch all saved reports
* The reports are displayed in a structured table
* Loading indicators are shown while data is being fetched
Each saved report includes:
* Report name
* Report URL
* Created by
* Created at
Users can:
* Open the report in a new tab
* Delete a report securely
* View creation details
Deletion process:
* User clicks delete
* A DELETE request is sent with authorization token
* On success, the report is removed from the list
* A success or error message is displayed
This feature ensures persistent report access, secure management, and easy report lifecycle control.